Issued 12 January 2023: Unless otherwise noted, temperature and precipitation rankings refer to a 129-year period of record (1895-2023), and long-term average refers to the 20th-century (1901-2000) value. Data for 2023 should be considered preliminary. The most up-to-date temperature and precipitation data is available through Climate at a Glance.
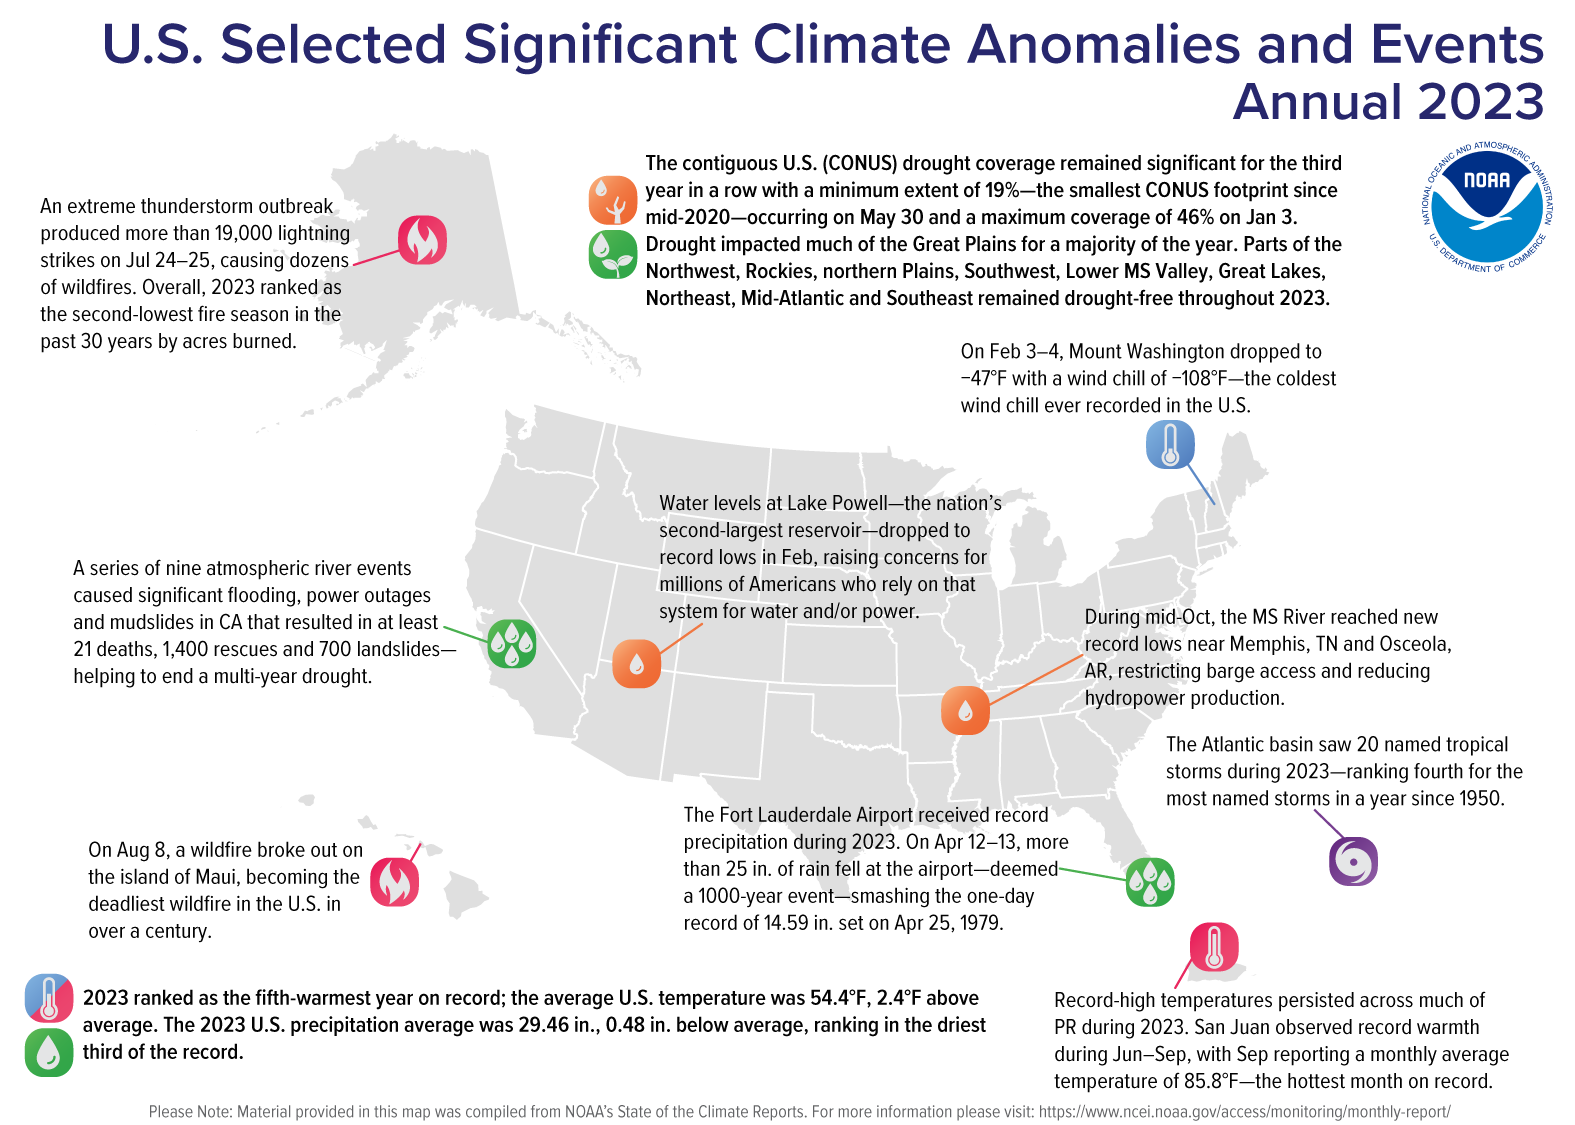
Based on preliminary analysis, the average annual temperature for the contiguous U.S. was 54.4°F, 2.4°F above the 20th-century average, ranking as the fifth warmest year in the 129-year record.
Most of the contiguous U.S. experienced above-average temperatures during 2023, with near- to below-average temperatures from parts of the central Rockies to California. Texas, Louisiana, Mississippi, New Hampshire and Massachusetts each ranked warmest on record while Maine, Vermont, Connecticut, Maryland, Virginia and Florida each ranked second warmest in the 129-year record. An additional 24 states experienced a top-10 warmest January-December on record.
The contiguous U.S. average maximum (daytime) temperature for 2023 was 66.2°F, 2.2°F above the 20th century average, ranking eighth warmest in the historical record. Above-average temperatures were observed across much of the eastern contiguous U.S., the Great Plains and in portions of the central Plains, Southwest and along the Northern Tier. Near- to below-average temperatures were observed from the central Rockies to the West Coast and in parts of the northern Plains and Southwest. Louisiana, Florida and Maryland each ranked warmest on record, while 28 additional states ranked among their top-10 warmest for daytime temperatures during this 12-month period.
The contiguous U.S. average minimum (nighttime) temperature during 2023 was 42.7°F, 2.6°F above the 20th century average, ranking sixth warmest in the historical record. Above-average nighttime temperatures were observed across almost the entire contiguous U.S. Texas, Louisiana, Mississippi, Vermont, New Hampshire, Massachusetts and Rhode Island each ranked warmest on record. An additional 28 states ranked among their top-10 warmest year for nighttime temperatures.
Based on REDTI, the contiguous U.S. temperature-related energy demand for 2023 was four percent of average and the third-lowest value in the 129-year period of record.
The contiguous U.S. average annual precipitation was 29.46 inches, 0.48 inch below average, ranking in the driest third of the 129-year record.
Despite near-normal precipitation at the national scale, 2023 witnessed several significant events at the regional scale, including a series of atmospheric rivers across much of the West and several extreme storms that brought record precipitation to parts of the U.S. this year. Drought remained extensive across much of the Great Plains throughout 2023.
For the year as a whole, precipitation was above average across much of the Northeast, from parts of the western Plains to California, as well as in parts of the Great Lakes, southern Plains, Mississippi Valley and Southeast. Precipitation was below average from parts of the Southwest to the Gulf of Mexico, parts of the Northwest, the Ohio Valley to Mid-Atlantic and much of the Mississippi Valley. Louisiana had its eighth-driest year on record. Conversely, Maine ranked fifth wettest, while Vermont and Connecticut each ranked sixth wettest on record for this 12-month period. Three additional states ranked among their top-10 wettest years on record.
According to the U.S. Drought Monitor (USDM), drought coverage across the contiguous U.S. remained significant for the third year in a row. The year began with the peak coverage of 46.3 percent of the contiguous U.S in drought. Drought coverage shrank as late winter and spring atmospheric rivers and the summer monsoon brought above-normal precipitation to much of the western U.S, recharging some of the major reservoirs that dropped to their lowest levels in 2022. Drought reached a minimum extent of 19 percent on May 30—the smallest contiguous U.S. drought footprint since mid-2020.
The Alaska January-December temperature was 28.4°F, 2.4°F above the long-term average, ranking 17th warmest in the historical record for the state. Much of the state was above normal for this annual period while temperatures were near average across parts of southern, western and interior parts of the state.
The annual precipitation ranked fifth wettest in the 99-year record for Alaska, with above-average precipitation observed across most of the state. Near-normal precipitation was observed in parts of the Southwest, while parts of the Aleutians experienced below-average precipitation during this period. Over 78 inches of snow accumulated in Anchorage October-December, becoming the snowiest start to the water year (October - September).
It was a historic year of U.S. billion-dollar weather and climate disasters as 2023 ranked first for the highest number of billion-dollar disasters in a calendar year, surpassing the previous record of 22 in 2020. These disasters included: 17 severe storms, four flooding events, two tropical cyclones, two tornado outbreaks, one winter storm, one wildfire and one drought and heat wave event.
The U.S. disaster costs for 2023 was $92.9 billion and they have resulted in 492 direct and indirect fatalities. The costliest events in 2023 were:
Over the last seven years (2017–2023), 137 separate billion-dollar disasters have killed at least 5,500 people and cost greater than $1 trillion in damage. This is also a record 13th consecutive year where the U.S. experienced 10 or more billion-dollar disasters and the fourth consecutive year (2020–2023) where 18 or more billion-dollar disasters impacted the U.S.
Since these billion-dollar disaster records began in 1980, the U.S. has sustained 376 separate weather and climate disasters where overall damages/costs reached or exceeded $1 billion (based on the CPI adjustment to 2023) per event. The total cost of these 376 events exceeds $2.660 trillion.
Record-warm sea surface temperatures in the Atlantic basin brought 20 named tropical systems during 2023, ranking fourth for the most named storms in a year since 1950. Seven of these storms were hurricanes, including three that intensified to major hurricanes, while three of these storms made landfall in the U.S.—Hurricane Idalia and tropical storms Harold and Ophelia. Several notable storms brought destruction and flooding to portions of the U.S. and its territories during the months of August and September:
The 2023 tornado count was above the 1991–2020 annual average across the contiguous U.S. with 1,197 confirmed tornadoes reported, with an additional 97 preliminary tornadoes during the October 1 to December 31 period yet to be verified.
The U.S. Climate Extremes Index (USCEI) for 2023 was 65 percent above average and ranked 11th highest in the 114-year record. On a whole, elevated extremes in both warm maximum and minimum temperatures throughout the year were the main contributor to this above-average value. On a regional basis, the South and Northeast ranked second and third-highest on record, respectively, for extremes during 2023. Elevated warm extremes in both maximum and minimum temperature were observed across portions of the Northeast, Ohio Valley, Upper Midwest, Southeast, South and Northwest. Elevated extremes in the number of days with precipitation, one-day precipitation and wet Palmer Drought Severity Index values were also seen in the Northeast, while the South also experienced elevated extremes in one-day precipitation and dry PDSI values. The West experienced elevated extremes in wet PDSI values. The USCEI is an index that tracks extremes (falling in the upper or lower 10 percent of the record) in temperature, precipitation, drought and landfalling tropical cyclones across the contiguous U.S.
For additional details regarding these highlights, please see the following pages:
*Temperature and precipitation values and ranks are based on preliminary data. Additional data received and processed after the release of this summary may result in small differences for annual values and ranks.
These regional summaries were provided by the six Regional Climate Centers and reflect conditions in their respective regions. These six regions differ spatially from the nine climatic regions of the National Centers for Environmental Information.
A record warm year, punctuated by a damaging cold spell, produced precipitation extremes from intensifying drought to flood-inducing rainfall.
The Northeast experienced its second-warmest year since recordkeeping began in 1895 with an annual average temperature for 2023 of 49.9 degrees F, 2.2 degrees F above normal. 2023 was record warm for Massachusetts and New Hampshire and ranked as the second warmest year on record for Connecticut, Maine, Maryland, and Vermont. Meanwhile, it was the third warmest year on record for Delaware, New Jersey, New York, Pennsylvania, and Rhode Island and the sixth warmest year for West Virginia. Annual average temperatures for the 12 Northeast states ranged from 1.4 degrees F above normal in West Virginia to 2.8 degrees F above normal in Vermont. 2023 became the warmest year on record for 13 of the Northeast’s 35 major climate sites including Burlington, Vermont; Central Park, New York; Harrisburg, Pennsylvania; Baltimore, Maryland; and Dulles Airport, Virginia. January 2023 was the warmest January since record-keeping began for Connecticut, Maine, Massachusetts, New Hampshire, New Jersey, Rhode Island, and Vermont, as well as 10 of the Northeast’s 35 major climate sites including Newark, New Jersey; Worcester, Massachusetts; Bridgeport, Connecticut; Dulles Airport, Virginia; Allentown, Pennsylvania; Portland, Maine; and Central Park, Islip, Kennedy Airport, LaGuardia Airport, New York. Numerous other temperature records were set throughout the Northeast during January. The average temperature was above normal every day during January for sites such as Philadelphia, Pennsylvania, and Central Park, which experienced their longest such streak at 37 days (December 28 through February 2) and 35 days (December 28 through January 31), respectively. Several sites in New York and New England including Boston, Massachusetts; Providence, Rhode Island; Concord, New Hampshire; and Albany, New York, set/tied their greatest number of January days with a high of at least 32 degrees F. For instance, the high temperature in Hartford, Connecticut, was at or above freezing every day in January for the first time on record. Similarly, the number of days with low temperatures at or above 20 degrees F tied or set records at multiple sites in New York and New England including Bridgeport, Connecticut; Binghamton, New York; and Burlington, Vermont. In fact, the low temperature in Worcester, Massachusetts, was at least 20 degrees F on 30 days in January, beating the old record of 25 days set in 2002. Similarly, the temperature in Harrisburg, Pennsylvania, remained at or above 26 degrees F this January. All other Januarys back to 1889 at the site have recorded a colder temperature. This milestone of the lowest temperature during January ranking as the warmest on record occurred at 25 of the region’s 35 major climate sites. February 2023 was the warmest February on record for Baltimore, Maryland, at 44.7 degrees F, beating the old record of 44.2 degrees F from 2017. On February 16, Islip, New York, and Bridgeport, Connecticut, had their warmest high temperatures for February with highs of 71 degrees F and 68 degrees F, respectively. On the same day, LaGuardia Airport, New York, and Worcester, Massachusetts, tied their warmest low temperatures for February with lows of 54 degrees F and 49 degrees F, respectively. Winter 2022-23 was the warmest on record for two major climate sites. The average winter temperature of 41.3 degrees F at Dulles Airport, Virginia, beat the old record of 40.8 degrees F from winter 2016-17. Meanwhile, Worcester, MA, had an average winter temperature of 33.7 degrees F, surpassing the previous record of 33.1 degrees F from winter 2001-02. Two major climate sites recorded their warmest high temperatures for winter, with Beckley, West Virginia, reaching 77 degrees F on February 22 and Dulles Airport, Virginia, recording 80 degrees F on February 23. April 2023 was the warmest April on record for Wilmington, Delaware; Newark, New Jersey; and Burlington, Vermont. Meanwhile, Hartford, Connecticut, tied its warmest April temperature on record with a high of 96 degrees F on April 14. Worcester, Massachusetts, and Scranton and Williamsport, Pennsylvania, saw their earliest occurrence of a day with a high of at least 90 degrees F. From June 3 to 9, Caribou, Maine, had its longest streak of June days with a high of less than 60 degrees F with seven such days. July 2023 was the warmest July on record for Maine and the all-time warmest month on record for Caribou, Maine, which saw an average temperature of 71.5 degrees F, beating the old record of 70.9 degrees F set in 2018. On September 6, Dulles Airport, Virginia, recorded a high of 100 degrees F, its hottest September temperature on record. On September 8, Islip, New York, and Caribou, Maine, had their warmest low temperatures on record for September at 77 degrees F and 67 degrees F, respectively. On October 4, Syracuse, New York, and Burlington, Vermont, experienced their warmest high temperatures for October on record with highs of 89 degrees F and 86 degrees F, respectively.
2023 became the Northeast’s 17th wettest year since 1895 with 47.53 inches of precipitation, 104 percent of normal. Annual precipitation for the 12 Northeast states ranged from 84 percent of normal in Maryland to 125 percent of normal in Connecticut, with eight states wrapping up 2023 on the wet side of normal. While West Virginia experienced its 20th driest year on record, 2023 ranked among the 14 wettest years for seven states: Maine, fifth wettest; Connecticut and Vermont, sixth wettest; Massachusetts, seventh wettest; New Hampshire, eighth wettest; Rhode Island, ninth wettest; and New York, 14th wettest. January 13 was the wettest January day on record for Caribou, Maine, with 1.78 inches of precipitation. Scranton, Pennsylvania, had its wettest April day on record with 3.06 inches of rain on April 30. May 2023 was the driest May since recordkeeping began for five major climate sites: Wilmington, Delaware; Binghamton, New York; and Philadelphia, Harrisburg, and Williamsport, Pennsylvania, with each seeing less than 0.75 inches of precipitation. Three major climate sites also had their greatest number of May days with no measurable precipitation, with 28 days at Harrisburg and 26 days at Williamsport and Binghamton. In fact, Binghamton, New York, had its driest 30-day period on record: 0.04 inches of precipitation from May 21 to June 7. Hartford, Connecticut, had its wettest July on record with 13.93 inches of precipitation, surpassing the old record of 11.24 inches from 1938. Similarly, Albany, New York, had a record wet July with 10.70 inches of precipitation, beating the old record of 9.91 inches from 2009. Summer 2023 was record wet in New Hampshire and Vermont, as well as for Albany, New York, which saw 18.89 inches of precipitation, beating the old record for 18.51 from 2009. September 2023 was the wettest September on record for Kennedy Airport, New York, with 13.01 inches of precipitation, beating the old record of 9.65 inches set in 1975. Much of this precipitation fell on September 29, which became Kennedy Airport’s all-time wettest day for any month on record with 8.05 inches of rain. Similarly, LaGuardia Airport, New York, also had its wettest September on record with 12.76 inches of precipitation. LaGuardia Airport also went on to have its wettest autumn on record with 19.71 inches of precipitation. December 2023 became the wettest December on record for Delaware and New Jersey with 8.23 inches of precipitation and 8.20 inches of precipitation, respectively. Allentown, Pennsylvania, and Bridgeport, Connecticut, recorded their wettest Decembers on record with 8.62 inches and 8.35 inches of precipitation, respectively. December 28 became the wettest December day on record for Islip, New York, with 3.04 inches of precipitation.
The U.S. Drought Monitor from January 3, 2023, showed less than 1 percent of the Northeast in moderate drought and 9 percent as abnormally dry. This included a sliver of moderate drought on Long Island and pockets of abnormal dryness in seven of the 12 Northeast states. Most areas saw improving conditions in January and February, with drought erased from the region and the overall footprint of abnormal dryness contracting. In fact, New Hampshire became free of drought and dryness for the first time since May 2020. The U.S. Drought Monitor from March 7 showed 2 percent of the Northeast as abnormally dry including small parts of southern Pennsylvania, southern New Jersey, and New York’s Long Island. During March and April, increasing precipitation deficits, below-normal streamflow, and declining soil moisture led to the introduction and expansion of moderate drought and abnormal dryness in portions of the Mid-Atlantic, southeastern New York, and southern New England. The U.S. Drought Monitor from April 25 showed 6 percent of the Northeast in moderate drought and 22 percent as abnormally dry. After conditions briefly improved in early May, widespread deterioration occurred between late May and mid-June as below-normal precipitation led to little soil moisture, low streamflow, and declining groundwater levels. Severe drought was introduced in south-central Pennsylvania and central Maryland, while moderate drought and/or abnormal dryness expanded to include parts of ten of the 12 states. The U.S. Drought Monitor from June 20 showed 34 percent of the Northeast in drought and 37 percent as abnormally dry. From late June through July, locally heavy rainfall chipped away at drought and dryness across much of the region. Drought and/or abnormal dryness was removed from New England and contracted in the Mid-Atlantic states and New York. The U.S. Drought Monitor from August 1 showed 4 percent of the Northeast in drought and 11 percent as abnormally dry. During August and September, drought and abnormal dryness persisted in parts of New York and the Mid-Atlantic, expanding in some areas and contracting in other areas. The U.S. Drought Monitor from October 3 showed 2 percent of the Northeast in drought and 15 percent as abnormally dry. Below-normal precipitation, decreased streamflow and groundwater levels, and reduced soil moisture were a few factors that led to deteriorating conditions in the Northeast during October and November. Drought and dryness expanded in the Mid-Atlantic and New York, with pockets of severe drought developing in western New York, central Maryland, and eastern West Virginia. The U.S. Drought Monitor from December 5 showed 6 percent of the Northeast in drought and 19 percent as abnormally dry. Wetter-than-normal conditions during December in eastern West Virginia, Maryland, much of Pennsylvania, Delaware, and New Jersey allowed drought and dryness to contract or ease. For instance, severe and moderate drought were erased from Maryland, while abnormal dryness was removed from Delaware and New Jersey. Interior locations saw less precipitation, allowing drought and dryness to persist in spots such as western New York, northwestern Pennsylvania, and southwestern West Virginia. Additionally, moderate drought was introduced on Nantucket and Martha’s Vineyard, Massachusetts. The U.S. Drought Monitor from December 26 showed one percent of the Northeast in severe drought, three percent in moderate drought, and 11 percent as abnormally dry. The most notable and widespread impacts from the drought and dryness seemed to be on water resources. Record low streamflow and/or groundwater levels were noted in western New York and parts of the Mid-Atlantic, particularly an area stretching from eastern West Virginia into Maryland and southern Pennsylvania across to southern New Jersey, at various times from June through December. Water conservation was encouraged by water suppliers in several of these areas, with mandatory water use restrictions implemented in parts of Maryland, including Emmitsburg and Myersville, and Pennsylvania, including Lock Haven and parts of York County. In June, daily drought monitoring operations began along the Potomac River, which supplies portions of the Mid-Atlantic including much of the Washington, D.C., metro area with water. At that time, below-normal streamflow on the river contributed to an abundance of algae that altered the taste and smell of the drinking water in some areas. After a brief hiatus, daily drought monitoring resumed along the Potomac River in late August and continued through much of autumn. In early September, low water levels caused boat tours to be cancelled along the historic Chesapeake and Ohio (C&O) Canal, which runs along the Potomac River. The Interstate Commission on the Potomac River Basin issued two special Water Supply Outlooks, one in early November and one in early December, due to ongoing dry conditions in the basin. During November, wells ran dry for at least 100 homes, as well as some businesses and farms, in part of western New York. Some residents utilized fill stations in neighboring communities or tanker trucks that were brought in to then haul water to their homes, with a dairy farm trucking in 60,000 gallons a day for its cows. Dry conditions also affected the agriculture industry during the growing season. Some growers began irrigating crops as early as May and relied on irrigation to keep plants growing; however, it increased operation costs. During June, farmers in Pennsylvania noted that emergence of some crops such as corn and soybeans was slow, there were issues such as uneven corn fill, it was difficult for newly planted crops to establish roots, and some pastures turned brown. However, the conditions were favorable for haymaking and allowed for plenty of fieldwork. Seeds failed to germinate and grass grew slowly in some eastern West Virginia locations, while growers in parts of Maryland noted stunted corn and soybean crops and slow growth of hay. For the week ending June 18, topsoil moisture was rated very short (the lowest rating) for 71 percent of Maryland and was rated short (the second lowest rating) for just under 50 percent of Pennsylvania and West Virginia. For the same period, pasture and range conditions were rated very poor or poor for just under half of Pennsylvania and around a quarter of Maryland. In September, crops such as apples and corn were harvested earlier than usual in south-central Pennsylvania due to dry conditions. There were also impacts on wildfire activity. From April through June, there was an increased risk of wildfires, with multiple fires in states such as Pennsylvania, New York, and New Jersey. In April, West Virginia issued a week-long ban on all outdoor burning. During June, several municipalities and counties in central Pennsylvania enacted burn bans and state officials temporarily prohibited open fires in all state forests. Between January 1 and mid-June, New Jersey had seen at least 10 major fires, with two large fires in June caused by lightning, an uncommon occurrence in the state. Pennsylvania also saw an uptick in wildfires. During fall, low water levels in ponds and creeks in southern Pennsylvania and western New York affected rural firefighting operations. Dry conditions increased fire danger during West Virginia’s fall fire season and contributed to multiple wildfires, including one in the New River Gorge National Park and Preserve that burned over 2,000 acres. Similar conditions were found in Virginia, which saw multiple large wildfires. Smoke from these fires produced poor air quality and smoky skies in parts of the Northeast, particularly mid-November as drought conditions generally peaked in that state.
With above-normal temperatures and an unfavorable storm track for heavy snow, most of the Northeast experienced a snowfall deficit in January 2023. In fact, there was no measurable snow during January at Philadelphia, Pennsylvania; Wilmington, Delaware; Baltimore, Maryland; Dulles Airport, Virginia; Washington, D.C.; Newark, New Jersey; Bridgeport, Connecticut; and Islip, LaGuardia Airport, and Kennedy Airport, New York, tying several other years as the least snowy January on record. For Bridgeport it was the first January on record without measurable snow. The lack of snow affected winter recreation activities such as skiing and snowmobiling, with fewer trails open and a reduction in tourism revenue for businesses; however, transportation departments had a surplus of salt, helping their budgets. The warm weather allowed some maple syrup producers to tap trees earlier than usual because sap was already flowing; however, soft ground and ice limited access to forests for loggers, delaying projects. On February 1, up to eight weeks later than usual, several major climate sites including Dulles Airport, Virginia, and Central Park and Kennedy Airport, New York, finally saw their first measurable snow of the season. For those three sites, it was the latest first snow of the season, and for several other sites including Baltimore, Maryland; Philadelphia, Pennsylvania; and Washington, D.C., it was among the five latest. Unusually warm temperatures in February and during winter contributed to below-normal snowfall for many parts of the Northeast. This February was the least snowy on record for Harrisburg and Pittsburgh, Pennsylvania. Harrisburg received only a trace of snowfall, tying its record from 2020, while Pittsburgh saw 0.2 inches of snow, beating the old record of 0.5 inches from 1909. Meanwhile, Baltimore, Maryland, and Atlantic City, New Jersey, had their least snowy winter on record. Baltimore saw 0.2 inches of snow, beating its old record of 0.5 inches from winter 1949-50, while Atlantic City saw 0.3 inches of snow, beating its old record of 0.4 inches from winter 1972-73. According to modeled data from the USA National Phenology Network, spring leaf-out arrived in February in parts of the Mid-Atlantic and coastal Northeast, which was earlier than usual. For instance, spring leaf-out occurred in Baltimore, Maryland, nearly three weeks early and in New York City more than a month early. May brought an end to the 2022-23 snow season, which runs from October through May. Six major climate sites had their least snowy season on record: Beckley, West Virginia; Bridgeport, Connecticut; Central Park, New York; Dulles Airport, Virginia; Baltimore, Maryland; and Atlantic City, New Jersey. Seasonal snowfall deficits at these sites ranged from 17.1 inches below normal in Atlantic City, which saw only 0.3 inches of snow this season, to 44.4 inches below normal in Beckley, which accumulated only 11.5 inches this season. The lack of snow carried through into fall and December. Worcester, Massachusetts, and Hartford, Connecticut, only saw a trace of snowfall in December, tying as their least snowy Decembers on record. Additionally, a few major cities along the Interstate 95 corridor were experiencing their longest streak of days with less than an inch of snow. As of December 31, Baltimore, Maryland, had gone a record 702 days (last inch or more of snow was January 28, 2022) without seeing an inch of snow, while the record-long streak at Philadelphia, Pennsylvania, was at 701 days (last inch or more was January 29, 2022). Similarly, as of December 31, Central Park, New York, had gone a record 686 days without seeing an inch of snow (last inch or more was February 13, 2022), while the record-long streak at Dulles Airport, Virginia, was at 659 days (last inch or more was March 12, 2022). Low temperatures on May 18 bottomed out in the 20s and 30s in multiple parts of the Northeast, running as much as 22 degrees F colder than normal. For instance, lows of 30 degrees F in Scranton, Pennsylvania, and 33 degrees F in Providence, Rhode Island, ranked among the 10 coldest low temperatures for May at those sites. After a mild April, some crops were ahead of schedule, leaving them particularly susceptible to the unusually cold temperatures. Freeze damage was widespread but variable by location in New York and New England, resulting in millions of dollars in crop losses. For instance, losses of 70 to 100 percent of some grape varietals were reported at multiple vineyards in central and eastern New York, while New Hampshire officials indicated losses of 75 to 100 percent of apples, pears, and/or grapes at some farms throughout the state. Vermont officials reported severe damage to thousands of acres of crops, including losses of at least 30 percent of apple crops at most farms and complete losses at some farms. Similar damage was reported in Connecticut and Massachusetts. The consequences of the freeze damage carried over into the fall season as pick-your-own operations were limited at some orchards.
There were multiple notable severe weather events in the Northeast in 2023:
There were several significant flash flood events during the second half of 2023:
On nearly half of all May days, smoke from wildfires burning in western Canada, transported by the jet stream, created hazy skies in parts of the Northeast. On May 30 and 31, smoke from wildfires in eastern Canada and New Jersey led to reduced air quality in parts of the Mid-Atlantic. The weather pattern from around June 3 to 10 featured a stalled upper-level low pressure system near northern New England and a high-pressure system over the central U.S., producing northerly winds over much of the Northeast and ushering cooler-than-normal air and thick smoke from wildfires burning in the province of Quebec, Canada. Air Quality Alerts were in place for several days as the air smelled of smoke. The air quality index, which ranges from 1 to 500, reached 151 (unhealthy), 201 (very unhealthy), or even 301 (hazardous) in most Northeast states, with some locations approaching 500. Multiple locations had their poorest air quality since Environmental Protection Agency records began in 1999 including New York City. Visibilities were reduced to as little as a half-mile at times, leading to flight delays and, in some cases, temporary ground stops at major airports such Newark, LaGuardia, Kennedy, and Philadelphia. Major sporting events and outdoor activities were cancelled, while outdoor spaces such as zoos and parks were closed in some areas. Daily high temperatures were slightly cooler due to the thick smoke. Closer to the upper low, Maine was mostly spared from the worst of the poor air quality but saw numerous showers and cool temperatures. Parts of the Northeast saw additional rounds of wildfire smoke, mostly aloft, through mid-month. June wrapped up as it began—with a significant amount of wildfire smoke pouring into the region. While not as intense as the early-June event, air quality between June 28 and 30 reached unhealthy levels in multiple states and very unhealthy levels in Pennsylvania. Smoke hung in the air, reducing visibilities, leading to closures of things such as pools and camps, and sending outdoor activities inside. Multiple Air Quality Alerts were issued in July, particularly on July 17 and 18 when a plume of smoke, this time from wildfires burning in western Canada, reduced air quality and produced hazy skies in the Northeast. Air quality reached unhealthy levels in several areas including parts of Pennsylvania and New York. Additionally, smoke from wildfires burning in Canada returned to the Northeast in late September and lingered into early October, producing hazy skies and, in some locations, reduced air quality. Dry conditions in parts of the Mid-Atlantic increased fire danger during fall fire season and contributed to multiple large wildfires in West Virginia and Virginia. Smoke from these fires, particularly in Virginia in mid-November, produced poor air quality and smoky skies in parts of the Northeast.
From mid to late September, two tropical systems affected the Northeast. Hurricane Lee produced rough surf and rip currents along the East Coast from around September 13 to 16 as it traveled in the Atlantic Ocean toward eventual landfall in western Nova Scotia. The highest wind gusts ranged from 40 to 60 mph in coastal Massachusetts and Maine, which saw the greatest impacts. Downed trees and wires led to tens of thousands of power outages in Maine, including around 30 percent of customers in Washington County. That county also saw the greatest rainfall totals of up to 6.50 inches, resulting in flooded roads and basements. One storm-related death and a few injuries were reported in Maine. Tropical Storm Ophelia formed along the southeast U.S. coast on September 22 and made landfall in North Carolina on September 23. The storm’s remnants traveled across the Mid-Atlantic states and stalled off the coast through September 26. One of the storm’s big impacts was multiple days of higher-than-usual water levels, resulting in beach and dune erosion and flooding for coastal areas from Maryland to New Jersey. Some of those same areas saw the greatest rainfall totals of over 3 inches, with coastal New Jersey seeing over 4 inches, and the highest wind gusts of 40 to 60 mph, with scattered reports of downed trees and wires. Ophelia’s remnants drifted south and merged with another storm, helping produce an extreme rainfall event that led to major flash flooding in the New York City metro area on September 29. The greatest rainfall totals ranged from 4 to 9 inches, in some cases more than a month’s worth of rain in a single day. Kennedy Airport, New York, picked up 8.05 inches of rain, making it the site’s all-time wettest day since its records began in 1948 and qualifying as a 100-year storm event with a 1 percent chance of occurring in any given year. The rainfall pushed the airport’s September total to 13.01 inches, which ranked as the wettest September and fourth all-time wettest month for the site. Central Park, New York, recorded 5.48 inches of rain, ranking as its ninth all-time wettest day since recordkeeping began in 1869. The site picked up 2.98 inches of that in two hours, which equates to a 25-year storm event with a 4 percent chance of occurring in any given year. Travel became nearly impossible as the rain flooded roadways including portions of major thoroughfares such as FDR Drive. Some motorists abandoned vehicles, while others became trapped, with dozens of water rescues reported. Bus service was suspended in some areas as dozens of buses got stuck in floodwaters, while around half of New York City’s subway system was partially or fully shut down. Meanwhile, at LaGuardia Airport, floodwaters entered a terminal and swamped the refueling area, leading to flight delays and cancellations, and at Kenney Airport, flight delays topped 3 hours. Multiple buildings including basement apartments and at least 150 schools experienced flooding. On October 8, the frontal system interacted with the remnants of Tropical Storm Phillipe, bringing 4 to 6 inches of rain to parts of coastal and eastern Maine where a few roads sustained flooding damage. Additionally, wind gusts of 30 to 55 mph resulted in some downed trees and power outages in that state. A report indicated that part of Maine was in the National Hurricane Center's storm track forecast cone more frequently this hurricane season than typical areas like Florida.
The preliminary average temperature for the Midwest in 2023 was 51.1 degrees F (10.6 degrees C), which was 2.1 degrees F (1.2 degrees C) above the 1991-2020 normal. Preliminary rankings indicate 2023 was the 4th warmest year since 1895 for the Midwest. The entire region experienced warm conditions with temperatures ranging from 1-3 degrees F (0.6-1.7 degrees C) above normal. Preliminary statewide annual average temperatures ranged from 1.7 degrees F (0.9 degrees C) above normal in Kentucky to 2.5 degrees F (1.4 degrees C) above normal in Wisconsin. The following seven states had a top five warmest year on record based on preliminary data: Illinois (5th), Indiana (4th), Kentucky (4th), Michigan (Tied-3rd), Missouri (Tied-5th), Ohio (Tied-4th), Wisconsin (Tied-4th). Annual minimum and annual maximum temperatures followed a similar pattern, with all parts of the region above normal by about 1-4 degrees F (0.6-2.2 degrees C).
Notable Temperature-Related Station Records:
Annual precipitation for the Midwest was 32.77 inches (832.4 mm), which was 5.19 inches (131.8 mm) below the 1991-2020 normal, or 86 percent of normal. Most areas had below-normal precipitation with the exception of southern Michigan and a few isolate pockets across the region. A large swath of the western and southern Midwest had annual precipitation deficits of 6-15 inches (152.4-381 mm) for the year, with the greatest deficits in Iowa and Missouri. Preliminary statewide precipitation totals ranged from 0.55 inches (14 mm) below normal in Michigan to 8.72 inches (221.5 mm) below normal in Iowa. Snowfall for the 2023 calendar year varied from 100-150 percent of normal in the northwestern Midwest to less than 25 percent of normal in the southeast. Snowfall deficits in lake-effected areas downwind from Lakes Superior, Michigan, and Erie ranged from 20-50 inches (50.8-127 cm). Most of Kentucky had less than an inch (2.54 cm) of snowfall during the entire 2023 calendar year.
Notable Precipitation-Related Station Records:
The year was defined by large hydrologic swings throughout the Midwest starting with very wet conditions before drought rapidly onset mid-year and then ebbed and flowed to close the year. Abnormal dryness and drought covered 57 percent of the region in early January, affecting all nine states but with the most severe conditions in western Iowa. Widespread above-normal precipitation from January to early April reduced dryness and drought coverage to just 18 percent by late April, with dryness confined to west of the Mississippi River. Conditions started to rapidly decline across the region as the growing season ramped up. By late June, drought and dryness were widespread, covering 93 percent of the region and impacting all nine states. By July, exceptional (D4) drought spread across a multi-county stretch of central Missouri and extreme (d3) drought was present in Missouri, Iowa, and Wisconsin according to the U.S. Drought Monitor map. Conditions started to improve in the southeastern Midwest and into the central Midwest throughout July and August while lingering elsewhere. Drought severity peaked in the northwest in mid-September, with D4 drought affecting portions of Iowa, Minnesota, and Wisconsin before conditions started to gradually improve during the fall. Regional improvements stalled in the northwest and began to wane across the lower Midwest in November and December. The year ended with dryness and drought affecting 77 percent of the region, including all nine states, with the most intense drought in Iowa and across the lower Midwest from central Missouri eastward through Kentucky.
Unseasonal January Tornadoes: The year started off with tornadoes in January, on five separate days. Nine tornadoes on January 3 set a single-day January record in Illinois. On the 16th, Iowa had its first January tornadoes since 1967. In Kentucky, several tornadoes damaged buildings and downed trees.
March 31 Tornado Outbreak and Winter Storm: A strong cold front moved across the Midwest on March 31, spawning severe storms and blizzard conditions. The National Weather Service confirmed 139 Midwestern tornadoes along with 10 fatalities, over 75 injuries, and widespread destruction. An EF4 tornado hit southeast Iowa with wind speeds of 170 mph (274 kph), and Indiana had its first tornado-related fatality since 2012. Meanwhile, blizzard warnings plagued southern Minnesota and western Wisconsin; high winds and heavy, wet snow caused widespread power outages. Northern Wisconsin and Michigan’s Upper Peninsula measured upward of 20 inches (50.8 cm) of snow.
Vastly Different 2022-23 Snow Season Totals: Midwest snowfall totals were on the opposite ends of the spectrum for the 2022-2023 snow season. With over 140 inches (355.6 cm), Duluth, Minnesota, set a snow season record. Surprisingly, more than half of Duluth’s record snowfall came in just two months, December 2022 (45 inches/114.3 cm) and March 2023 (35 inches/88.9 cm). Conversely, snow was lacking in the southern and eastern Midwest. Cleveland, Ohio, measured the third lowest snowfall in 130 years with just 22.7 inches (57.7 cm).
Dust Storm Pileup in Illinois: On May 1, sustained winds of 35 to 45 mph (56 to 72 kph) and gusts up to 54 mph (87 kph) kicked up dust from freshly tilled fields, bringing treacherous driving conditions along I-55 near Springfield, Illinois. Just before 11 a.m., Illinois State Police responded to a 72-vehicle crash on a two-mile stretch of I-55 in Montgomery County caused by the near zero visibility. The crash claimed the lives of 7 and injured 37.
Canadian Wildfires Cause Poor Air Quality Across the Midwest: Historically large Canadian wildfires brought smoky and hazy conditions to the Midwest throughout the summer. The Air Quality Index (AQI) exceeded 101 (unhealthy for sensitive groups) nearly every day of June, with about half the days exceeding 151 (unhealthy). The worst air quality was measured on June 27 and June 28 when the AQI exceeded 201 (very unhealthy) across a large portion of the central Midwest, including areas near Madison, Chicago, Indianapolis, Detroit, and Cleveland.
July Leaves Chicago Soaked: The Midwest’s most populated region was inundated with multiple rounds of severe storms in July, leaving Chicagoland with 7-12 inches (177.8-304.8 mm) of rainfall for the month. Chicago’s Midway Airport measured a record-setting 11.28 inches (286.5 mm). One notable storm on July 2 dropped up to 8 inches (203.2 mm) on saturated ground, flooding major roads and railways, prompting water rescues, and canceling auto races and outdoor concerts.
Kentucky Sets Statewide Rainfall Record: Overnight on July 18-19, a wide swath of thunderstorms dumped 6-12 inches (152.4-304.8 mm) of rain across southeast Missouri, southern Illinois, and western Kentucky. Mayfield, Kentucky, which was still recovering from a major tornado, received 11.28 inches (286.5 mm) of rain in 24 hours, setting a new statewide record. These storms triggered flash flooding, water rescues, and infrastructure damage as local waterways rose several feet in less than 12 hours.
August 19-25 Heatwave: A late August heatwave brought most Midwestern cities their hottest temperatures of the year. Humidity was a huge factor, driving heat index values into the triple digits. In Kansas City, the heat index peaked at or above 115 degrees F (46.1 degrees C) for a record 5 consecutive days. A heat index of 120 degrees F (48.9 degrees C) at Chicago O’Hare on August 24 was the highest measured since records began in 1946. The extreme heat led to school closures, buckling pavement, livestock fatalities, and high energy demands across the region.
November Wildfires Across Kentucky: Drought, wind, and low humidity ignited over 265 wildfires across Kentucky in November, burning over 34,000 acres and claiming the lives of two firefighters. Over 100 firefighters from nine states provided support during the weeks-long ordeal.
Minnesota’s Record Warm, Wet December: December brought limited glimpses of winter across the North Star State. Minnesota had record-shattering warmth that averaged about 13 degrees F (7.2 degrees C) above normal for the month. Record precipitation was also measured statewide, although it mostly fell as rain. Snowfall totaled less than half of normal for the month. These unprecedented conditions led to unsafe ice conditions, cancelled dog sled races, and early sprouting of trees and flowers.
For further details on the weather and climate events in the Midwest, see the weekly and monthly reports at the Midwest Climate Watch page.
Temperatures in 2023 were above average across much of the Southeast region. Most locations were 1 to 2 degrees F (0.5 to 1.1 degrees C) above average, except across Florida, northern Virginia, and parts of the Carolinas, where temperatures were 3 to 4 degrees F (1.6 to 2.2 degrees C) above average. A few locations extending from central Georgia to central Virginia were near to slightly below average. Mean annual temperatures were 1 to 2 degrees F (0.5 to 1.1 degrees C) above average across Puerto Rico. Saint Thomas was near average for the year, while Saint Croix was 2 degrees F (1.1 degrees C) above average. Of 144 long-term stations (i.e. period of record of at least 75 years), 63 observed one of their top 5 warmest mean annual temperatures on record. Mobile, AL, Fort Myers, FL, Key West, FL, Miami, FL, Orlando, FL, Pensacola, FL, Raleigh-Durham, NC, Richmond, VA, and Roanoke, VA all observed their warmest year on record, while Daytona Beach, FL, and Tampa, FL tied their warmest year on record. Several other long-term stations observed or tied their second warmest (Washington D.C., Tallahassee, FL, Charleston, SC, Muscle Shoals, AL, West Palm Beach, FL, Vero Beach, FL, Atlanta, GA, Charlotte, NC), third warmest (San Juan, PR, Sarasota, FL, Birmingham, AL, Asheville, NC), fourth warmest (Wilmington, NC, Montgomery, AL), and fifth warmest (Melbourne, FL) year on record. Many stations also recorded their warmest month on record in July (Key West, FL, Fort Myers, FL, Sarasota, FL, Punta Gorda, FL, Brunswick, GA), August (Mobile, AL, Pensacola, FL, Tallahassee, FL, Daytona Beach, FL, Orlando, FL, Tampa, FL, Miami, FL), and September (San Juan, PR, Saint Croix). Charlottesville, VA recorded 145 days with a maximum temperature of at least 80 degrees F (26.7 degrees C), which tied for the most such days in a year since records began in 1893. A few other stations observed their highest annual count of days with a maximum temperature of at least 95 degrees F (35 degrees F), including San Juan, PR (19 days, breaking the previous record of 17 days set in 1983), Miami, FL (26 days, breaking the previous record of 15 days set in 2019), and Pensacola, FL (47 days, breaking the previous record of 39 days set in 1954). Mobile, AL recorded 11 days with a maximum temperature of at least 100 degrees F (37.8 degrees C), breaking the previous record of eight days set in 2000 (since 1871). Mobile also set its all-time highest daily maximum temperature of 106 degrees F (41.1 degrees C) on August 26th, breaking the previous record of 105 degrees F (40.6 degrees C) set on August 29, 2000. Plant City, FL, located east of Tampa, tied its all-time highest daily maximum temperature of 104 degrees F (40 degrees C) on July 5th (since 1892). The combination of heat and humidity was also record-breaking in places. For the year, Miami recorded 179 hours with a heat index of at least 105 degrees F (40.6 degrees C), breaking the previous record of 49 hours set in 2020 (since 1948). Miami also recorded 13 hours with a heat index exceeding 110 degrees F (43.3 degrees C), breaking the previous record of three hours set in 2017. Key West, FL recorded 380 hours with a heat index of at least 105 degrees F (40.6 degrees F), breaking the previous record of 185 hours set in 1981, and recorded 25 hours with a heat index of at least 110 degrees F (43.3 degrees C), breaking the previous record of five set in 1985 (since 1948). Several stations set or tied their highest heat index on record, including Brunswick, GA (122 degrees F (50 degrees C) on August 7th), Miami Executive Airport (122 degrees F (50 degrees C) on August 12th), Valdosta, GA (120 degrees F (48.9 degrees C) on August 8th), and Raleigh-Durham, NC (115 degrees F (46.1 degrees C) on August 15th). Key West, FL recorded its all-time highest minimum temperature of 88 degrees F (31.1 degrees C) on August 9th, breaking the previous record of 87 degrees F (30.6 degrees C) which was observed multiple times in 2023. Miami, FL tied its all-time highest minimum temperature of 84 degrees F (28.9 degrees C) on July 20th and October 12th. Miami also tied its all-time highest daily mean temperature of 90 degrees F (32.2 degrees C) on July 23rd. San Juan, PR tied its all-time highest daily mean temperature of 89 degrees F (31.7 degrees C) on August 24th.
Annual precipitation totals were variable across the Southeast region in 2023. The driest locations were found across the western Panhandle of Florida, southern Alabama, southwest North Carolina, and northern Virginia, where annual precipitation totals were 10 to 20 inches (254 to 508 mm) below average, with some locations running over two feet below average. Below average precipitation was also observed across northern portions of Alabama and Georgia and eastern portions of North Carolina and Virginia, where annual totals generally ranged from 4 to 8 inches (102 to 203 mm) below average. Precipitation was below average across the U.S. Virgin Islands. Saint Thomas recorded 25.46 inches (647 mm) for the year, which was the lowest annual precipitation total recorded across the entire Southeast region. The lowest total in the mainland Southeast was recorded in Tarpon Springs, FL, located north of Tampa, which observed its driest year on record (since 1892) with 25.50 inches (648 mm) of precipitation. Nearby Sarasota, FL also recorded its driest year on record (since 1911) with 27.13 inches (689 mm) of precipitation. In contrast, the wettest locations were found across southern and eastern Florida, the Big Bend region of Florida, southeastern Georgia, and central South Carolina, where annual precipitation totals were 10 to 20 inches (254 to 508 mm) above average, with some locations running over two feet above average. Above average precipitation was also observed across the eastern Panhandle of Florida and central portions of Alabama, Georgia, the Carolinas, and Virginia, where annual totals generally ranged from 4 to 8 inches (102 to 203 mm) above average. Augusta, GA recorded its third wettest year on record (since 1873) with 62.72 inches (1593 mm) of precipitation. The greatest annual precipitation total across the entire Southeast region was recorded in Fort Lauderdale, FL, which observed its wettest year on record (since 1912) with 113.61 inches (2886 mm) of precipitation. This breaks the previous record of 102.36 inches (2560 mm) set in 1947. Annual precipitation was generally below average across northern and interior portions of Puerto Rico and above average across the southern and eastern regions of the island. Charlotte, NC did not record any annual snowfall for the first time on record (since 1878). Richmond, VA tied its lowest annual snowfall total on record (since 1897) with a trace, while Asheville, NC recorded a trace of snow for the year for just the fifth time on record (since 1869).
January 2023 began with about 40 percent of the Southeast region in some designation of drought. Severe (D2) drought was found across the Florida Panhandle and extreme southern portions of Alabama and Georgia, while moderate (D1) drought and abnormal dryness (D0) were observed across central and southern portions of Alabama and Georgia, and eastern portions of Virginia and the Carolinas. Drought was largely absent across the Florida Peninsula and much of the interior of the region. Over the next several weeks, drought conditions were eliminated across much of the region, except across the Florida Peninsula, where moderate (D1) drought had emerged by the middle of February. Abnormal dryness (D0) emerged in Puerto Rico, while moderate (D1) emerged across the U.S. Virgin Islands. Over the next several weeks, abnormal dryness (D0) emerged across northwest Florida, southern portions of Alabama and Georgia, and central and eastern portions of North Carolina and Virginia, while severe (D2) and extreme (D3) drought emerged across the Florida Peninsula by early April. Moderate (D1) drought emerged across Puerto Rico, covering nearly half of the island by early April, while severe (D2) drought emerged on Saint Croix. Over the next several weeks, drought conditions would again improve across the Southeast, with a few pockets of abnormal dryness (D0) scattered across much of the region by the end of spring. The only exception was a narrow band of moderate (D1) and severe (D2) drought along the West Coast of Florida that would further narrow and intensify through the rest of the year. Drought coverage remained relatively low across the mainland Southeast (less than 10 percent of the region) for much of the summer while drought conditions worsened across the Caribbean. Severe (D2) drought emerged across Puerto Rico and Saint John, extreme (D3) drought emerged on Saint Thomas, and exceptional (D4) drought emerged on Saint Croix over the summer. Drought conditions eventually worsened again across the mainland Southeast. By mid-October, over 25 percent of the region was in at least moderate (D1) drought, mostly across the interior of the region. Extreme (D3) drought emerged across southern Alabama and northwest Florida, while severe (D2) drought was found across central and northern portions of Alabama, as well as the Shenandoah Valley of Virginia. Drought also worsened across the U.S. Virgin Islands, with exceptional (D4) drought emerging across Saint Croix and Saint Thomas, while some moderate (D1) drought persisted across Puerto Rico. By early November, exceptional (D4) drought had emerged across northern portions of Alabama and Georgia, while severe (D2) and extreme (D3) drought expanded along the northern Gulf Coast and across the interior of the region. Drought coverage across the mainland Southeast peaked in late November, with more than 60 percent of the region in at least moderate (D1) drought and over 40 percent of the region in at least severe (D2) drought. A wet December helped alleviate drought conditions across the interior of the region. By the end of the year, over 50 percent of the region was at least abnormally dry (D0), while a third of the region was in at least moderate (D1) drought. Severe (D2) drought remained across northern portions of Alabama, Georgia, and Virginia, while small areas of extreme (D3) drought persisted across northern Alabama and the West Coast of Florida. Abnormal dryness (D0) covered about 50 percent of Puerto Rico, with just a small area of moderate (D1) drought on the northwest corner of the island. Severe drought (D2) was found on Saint Thomas, while moderate (D1) drought prevailed on Saint Croix. Saint John was drought-free at the end of the year.
The 2023 Atlantic hurricane season was above average in terms of the number of storms and accumulated cyclone energy. In total, there were 20 named storms, which is the fourth highest number of storms in a season and the most named storms in an El Nino season since 1950. Of these storms, seven became hurricanes and three became major hurricanes, which are Category 3 and higher (Franklin, Idalia, and Lee). While the number of named storms was above the climatological average of 14, the number of hurricanes and major hurricanes were at their climatological averages (over the period 1991-2020). The total accumulated cyclone energy in the Atlantic basin was about 120 percent of average. Of the 20 named storms, seven affected the Southeast region, including all three major hurricanes. Tropical Storm Arlene dropped 1 to 2 inches (25 to 50 mm) of precipitation across parts of South Florida on the 2nd and 3rd of June. Hurricane Franklin dropped up to 3 inches (76 mm) of precipitation across the southern end of Puerto Rico and 1 to 2 inches (25 to 50 mm) across the U.S. Virgin Islands while a tropical storm from August 20th to the 22nd. Hurricane Idalia made landfall near Keaton Beach, FL on the morning of August 30th. It was the strongest hurricane to strike the Big Bend region of Florida in over a century, with winds of 125 mph. The storm surge reached 8 feet (2.4 m) at Cedar Key, resulting in catastrophic flooding. High winds, flash flooding, and tornadoes were reported across eastern portions of Georgia and the Carolinas. Major flooding was observed in downtown Charleston. At least five deaths were confirmed in the Southeast. The circulation associated with Hurricane Lee contributed to high surf and dangerous rip currents in Puerto Rico and the U.S. Virgin Islands on the 11th and 12th of September. Tropical Storm Ophelia made landfall in Emerald Isle, NC on the morning of September 23rd with winds of 70 mph (31 m/s). Storm surge of 2 to 4 feet (0.6 to 1.2 m) was observed along the Outer Banks. Tidal flooding was reported in eastern North Carolina and Virginia, while flash flooding was observed further inland. Wind gusts up to 50 mph (22 m/s) also contributed to power outages across central portions of North Carolina and Virginia. Tropical Storm Philippe brought beneficial precipitation to Puerto Rico and the U.S. Virgin Islands from the 3rd to the 5th of October. Saint Croix and Saint Thomas recorded 2 to 4 inches (50 to 102 mm) of precipitation, while some gauges on Saint John recorded over 8 inches (203 mm). More than 5 inches (127 mm) of precipitation fell across eastern portions of Puerto Rico. A few weeks later, rain bands connected with Hurricane Tammy dropped another 2 to 4 inches (50 to 102 mm) of precipitation across Puerto Rico and 1 to 2 inches (25 to 50 mm) across the U.S. Virgin Islands from the 18th to the 23rd of October.
There were 5,871 reports of severe weather across the Southeast region in 2023, which is nearly double the median annual frequency of 3,010 reports over the period 2000 to 2022 (195 percent of normal). The fewest number of reports was found in South Carolina (536 reports, 9 percent of the total), while the greatest number was found in Georgia (1,485 reports, 25 percent of the total). Thunderstorm winds accounted for 85 percent of all severe weather reports (212 percent of normal). A total of 196 tornadoes (80 EF-0s, 87 EF-1s, 23 EF-2s, 6 EF-3s) were confirmed across the Southeast in 2023, which is above the median frequency of 153 (128 percent of normal). There were two large outbreaks in January (one on the 3rd and 4th, the other on the 12th) that caused considerable damage across central portions of Alabama and Georgia, most notably to a daycare facility in Selma, AL. Nine fatalities and over 50 injuries were confirmed from these outbreaks, which spawned nearly 60 tornadoes. Another outbreak in this area from March 24th to the 27th resulted in one fatality and five injuries. Between June 14th and 19th, two dozen tornadoes touched down across southern portions of Alabama and Georgia and North Florida as part of a severe weather outbreak that included winds over 90 mph (40 m/s) and hail up to 4 inches (102 mm) in diameter. One person died in Pensacola when a tree fell on their home. Eleven tornadoes were confirmed across the Florida Peninsula on October 11th and 12th, resulting in major structural damage and flipped vehicles. Several other tornadoes were impactful during the year. On April 1st, an EF-3 tornado destroyed several homes in Madison County, AL. One fatality and five injuries were confirmed. At the end of the month, an EF-3 tornado caused major damage to over 100 homes, vehicles, and boats in the Virginia Beach area. Another EF-3 tornado caused significant damage to a large manufacturing plant and flipped multiple tractor-trailers in eastern North Carolina on July 19th. At least 16 people were injured. In addition, two tornadoes were confirmed in Puerto Rico, an EF-1 on July 16th and an EF-0 on August 9th. There were 642 reports of hail in 2023, which is above the median frequency of 501 reports (128 percent of normal). The largest hailstone was 4.75 inches (121 mm) in diameter and fell in Caroline County in eastern Virginia on August 7th. This was the third largest hailstone on record in Virginia (since 1950). In addition, pea-sized hail was recorded in Saint Croix on April 6th. This marks only the second time since 1955 that hail has been recorded in the U.S. Virgin Islands. There were 93 surf zone fatalities in the United States in 2023. Of these, 60 (65 percent) occurred in the Southeast region. There were 13 lightning fatalities in the United States. Of these, six (46 percent) occurred in the Southeast region.
Climate-wise, 2023 was the opposite of 2022, which was marked by dryness and extreme drought. This year brought ample to plentiful precipitation to much of the region, which greatly improved drought conditions. While the precipitation was beneficial to mitigate drought conditions, it was too late to help some crops to recover. In August, a blistering heatwave further impacted all facets of life including agriculture. This heatwave led to a warm end to the year, culminating in a record-breaking December.
Overall, temperatures this year were slightly above normal for most of the region. Wyoming and parts of Colorado observed below normal temperature due to a very cool start of the year. Temperatures were mild for the rest of the region outside of May and June, before the entire region heated up from August until the end of the year. Multiple heatwaves impacted the region during the late summer and well into the fall, with temperatures surpassing 90 degrees F (32.2 degrees C) in Kansas during November. A dangerous and unbearable heatwave combined with extremely high dewpoints in August led to heat indices topping 130 degrees F (54.4 degrees C) in the southern Plains.
The following locations had notable temperature records during 2023:
Precipitation came in spurts this year, with extreme amounts of precipitation occurring during several months. Snowfall was abundant in South Dakota, Wyoming, and northern Nebraska to start the year, but the rest of the region was rather dry. An onslaught of storms in May dumped generous amounts of rain across eastern Colorado, northwestern Kansas, and southwestern Nebraska, greatly improving drought conditions. Rain continued to pour into July for Colorado and Wyoming, with record wetness. Throughout the rest of the year, precipitation was not as widespread, however, those that did receive some were given generous amounts. Several locations recorded their wettest year, thanks to heavy snowfall at the beginning of the year and heavy rainfall towards the end. Compared to the extreme dryness that characterized 2022, this year leaves the region in much better shape heading into 2024. Severe weather, particularly wind and hail, ravaged Colorado, Nebraska, and Wyoming this year. Colorado recorded their highest number of severe thunderstorm and tornado warnings issued in a year (period of record 2002-2023), with 1366. The Dakotas were the opposite, with a near-record low number of warnings issued. Hail wreaked havoc in Colorado, with two storms among the most notable. A hailstorm on June 21st interrupted a concert at the Red Rocks Amphitheater outside of Denver, with nearly 100 people injured after failing to heed warnings. The other storm occurred on August 8th, when a 5.25-inch (13.34 cm) hailstone fell outside of Kirk. After verification by the State Climate Extremes Committee, this would officially beat out the previous record of 4.83 inches (12.27 cm) from a stone from Bethune in 2019. In Kansas, a 115 mph (185 km/h) wind gust was recorded outside of Wallace. Combined with 2.5-inch (6.35 cm) hail, severe damage was reported from anything in the path of the deadly storm.
The following locations had notable precipitation records during 2023:
According to the U.S. Drought Monitor, overall drought coverage dramatically improved across the region. Heavy precipitation occurred this year primarily over areas plagued by drought coming into 2023. Undoubtedly, the biggest winner in 2023 was Kansas. Entering the year, close to 57 percent of the state was under extreme to exceptional drought (D3-D4) conditions. That number is down to 3 percent heading into 2024, a significant and much overdue improvement. While much of the state is still dealing with drought or abnormally dry (D0) conditions, the outlook is much more optimistic heading into the new year. Nebraska also improved significantly this year, however, the drought that does remain is intense. In the beginning of January, 99.75 percent of the state was affected by moderate to exceptional drought (D1-D4). By the end of the year, it was reduced by 73 percent with only the southeastern part of the state remaining under significant drought. The Dakotas also experienced noticeable improvements, with both states experiencing a 60 percent reduction in D1-D4 conditions over the year. South Dakota is also primed to have further reductions to drought conditions early in the new year after a winter storm impacted the state around Christmas. In a reversal from last year, drought conditions are in manageable and decent condition heading into 2024. Overall, 21 percent of the High Plains was in D1-D4 at the end of the year, the lowest percentage since May 2020.
Record-Breaking Hailstone in Colorado: Capping off an unusually active severe weather season in Colorado was the recovery and examination of a 5.25-inch (13.34 cm) hailstone on August 8th in Yuma County. A storm chaser reported significant hail near the town of Kirk and managed to recover a stone larger than a softball. With a caliper on-hand, he was able to photograph some measurements, but some melting occurred before it could be officially measured. The local National Weather Service office in Goodland, Kansas convened the State Climate Extremes Committee to verify if it would break the recent record of 4.83 inches (12.27 cm) in 2019. Despite the melting during transportation, the initial measurements and photographs were sufficient evidence to certify that it would become the new record for the state. Drought Improvement Across the Region: The outlook for the multi-year drought in the High Plains seemed very bleak coming into 2023, with the previous year leaving Kansas and Nebraska in a dire situation. After multiple months of torrential rainfall, both states experienced significant improvements. D3-D4 was nearly eradicated in Kansas, however, a small patch does remain in Nebraska. The region as a whole is at the lowest percentage of drought conditions in nearly three years. Agriculture Struggled Again: Despite the beneficial and significant amounts of precipitation, it was too late to improve winter wheat yields. Kansas harvested its lowest bushel count since 1966, with numerous fields abandoned due to the dry fall in 2022. Corn production was aided by the rains, however, the heatwave in August burnt many stalks to a crisp. North Dakota also recorded its largest cattle anthrax outbreak since 2005 due to a dry to suddenly wet pattern. The mild fall this year allowed the disease to linger, with a case reported in December. Late August Heatwave: A rather unusual and deadly heatwave impacted the lower Plains in August. Temperatures reached up to 115 degrees F (46.1 degrees C) in Manhattan, Kansas and the average high for the week was 108 degrees F (42.2 degrees C). The presence of dewpoints up to 80 degrees F (26.7 degrees C) made this heatwave so unusual. Over 1000 temperature records were broken, with significant disruptions to daily life. Record power usage was recorded, placing a serious strain on utility providers. Schools in Kansas and Nebraska canceled classes or released students early to limit heat exposure outside or on buses.
The year 2023 was a record setting warm year across the Southern Region, ranking 1st warmest out of 129 years of weather records. All states within the Region were much warmer than their recent 1991-2020 normal temperatures and their long-term 1895-2023 averages, with all six states being in the top 10 warmest years on record. Louisiana, Texas, and Mississippi all recorded their warmest year on record in 2023, Arkansas ranked 4th warmest, Tennessee ranked 5th warmest, and Oklahoma ranked 10th warmest. January started off the year with well above normal temperatures across the Southern Region, a common theme in 2023. Five of the six states in the Region recorded top 10 warmest Januarys . February brought more moderate temperatures to Texas (29th warmest) and Oklahoma (36th warmest) compared to January, while the eastern portions of the Region remained well above normal: Tennessee (3rd warmest), Mississippi (6th warmest), and Louisiana (8th warmest), and Arkansas (13th warmest). The first triple digit temperatures for the year were recorded in February: Falcon Lake, Texas (102 F, February 23rd) and Linn-San Manuel, Texas (100 F, February 23rd). The well above average temperatures continued for much of the Region during March, ranking 30th warmest for the Region. April saw a change for the Region with temperatures running close to their historical median values. May saw the return to above normal temperatures across much of the Region, particularly in western Oklahoma with temperatures 2 to 4 F above normal. May also marked the last month in Spring where the Region saw temperatures below freezing. Temperatures in June were above normal for the southern portions of the Region and below normal in the north and east. The big story for June, and the remainder of the summer for the southern portions of the Region, was the beginning of periods of record-breaking temperatures. During June 14-19, there were 52 daily maximum temperature records set and 86 daily high minimum temperature records set, an indication of the high humidity that was present during the early part of the heat wave. The heat wave peaked on June 21-23, with five all-time maximum temperature records, three all-time high minimum temperature records, and a total of 205 daily maximum and high minimum temperature records. Rio Grande Village in Big Bend National Park on June 23 came within a degree of tying the all-time temperature record for the state of Texas. The extreme heat continued into July for the southern portions of the Region, while near-normal temperatures were present in the north. Particularly hard hit was Texas, where 123 stations reported 3 weeks or more of 100+F days during July. In eastern Texas and Louisiana, these high temperatures were accompanied by high humidity and led to several heat-related fatalities. August came along with more record-breaking heat in 2023, with Louisiana and Mississippi having their warmest August on record. Texas and the Southern Region as a whole ranked 2nd warmest. The extreme heat in the Region has particularly impacted Texas, where 285 stations in the state reported 3 weeks or more of 100+ F days during August. The records kept on falling with the arrival of fall in the Southern Region, with Texas recording its warmest September on record, with a mean temperature of 81.8F, 5.5 F above its 1990-2020 normal. All six states in the Region were above normal for September. October was also above normal for much of the Region, though more moderate than September. The Gulf Coasts of Texas, Louisiana, and Mississippi saw some relief with temperatures ranging from near normal to slightly below normal. Temperatures were near normal across much of the Southern Region during November, with stations across the Region typically within two degrees F of normal. The exceptions to this included the Texas and Oklahoma Panhandles where temperatures were three to five degrees above normal. Temperatures were near-normal to above-normal across the Southern Region during December. No long-term stations in the Southern Region set a record for highest maximum temperature or lowest minimum temperature for December.
Total precipitation for the year ranged from 9th driest for Louisiana (43.5 inches) to 44th wettest for Arkansas (52.32 inches) and Oklahoma (36.64 inches). The Southern Region as a whole recorded its 33rd driest (34.38 inches) year on record. No long-term stations in the Region set records for their all-time wettest calendar year. Six long-term stations in the Southern Region recorded their driest calendar year on record in 2023: Orange 9 N, Texas (38.08 inches), Nixon, Texas (16.06 inches), Greenwood Leflore Airport, Mississippi (35.67 inches), Covington 8 WNW, Louisiana (39.3 inches), Sulphur, Louisiana (30.63 inches), and Alexandria Esler Field, Louisiana (28.93 inches). In January, the year started off with wet conditions for the east of the Region and near-median values for Texas and Oklahoma. February saw near normal precipitation across much of the Region, with isolated areas of well-above normal precipitation in eastern Oklahoma, western Arkansas, and the Big Bend area of Texas. Deep south Texas was well below normal for February. March saw above normal for the northern-tier of the Region, while the remainder of the Region recorded below-normal precipitation (particularly the Oklahoma and Texas panhandles). Precipitation was below normal in April for the western and northern portions of the Region and well above normal along the Gulf Coast in Texas and Louisiana, much of eastern Texas, southern Arkansas, and northwestern Louisiana. May precipitation was below normal for much of the eastern and central portions of the Region in addition to far west Texas. Precipitation was well above normal across central Texas, the Texas and Oklahoma panhandles, and in deep south Texas. As summer began, precipitation was below normal for much of the southern and northeastern portions of the Region during June. Precipitation was well above normal for western Oklahoma, the Texas Panhandle, extreme northeast Texas, southern Arkansas, and central Mississippi in June. Four stations exceed thirteen inches of precipitation for the month of June, all in Mississippi. The southern portions of the Region saw below normal precipitation in July and above normal in the north, with some locations in western Oklahoma and the Texas Panhandle exceeding 300 percent of normal precipitation. A total of 58 stations, all in Texas, recorded no precipitation during the month of July. Precipitation was below normal for much of the Southern Region during August except for much of Tennessee, northern Arkansas, and deep south Texas. State totals were extremely low for Louisiana, which experienced its driest August on record with 1.27 inches of precipitation vs. the 1991-2020 normal of 5.1 inches. Precipitation was below normal for most of the Southern Region during September except for central Texas, portions of the Texas and Oklahoma Panhandles, and isolated areas of eastern Texas, Oklahoma, and western Arkansas. Precipitation in the Southern Region during October was well above normal across much of Texas, Oklahoma, and Arkansas, except for portions of the Texas and Oklahoma Panhandles and far west Texas. Below normal precipitation was observed across Louisiana, Mississippi, and Tennessee. Three CoCoRaHS stations, all in Texas, had single-day accumulations exceeding ten inches: near Texarkana (10.76 inches, October 5th), near Terrell (10.59 inches, October 28th), and near New Boston (10.08 inches, October 5th). Precipitation in the Southern Region during November was generally below normal with isolated areas of well above normal precipitation. Areas that experienced well above normal precipitation include extreme north-central Oklahoma and far west and deep south Texas where November precipitation was 130 to 300 percent of normal. Precipitation in the Southern Region during December was near or below normal, except for central Oklahoma, the Gulf Coasts of Louisiana and Mississippi, and the Oklahoma and Texas Panhandles where precipitation was 150 percent to 400 percent of normal. Seven long-term stations set single-day accumulation records for December across Texas, Louisiana, and Oklahoma.
In the first week of 2023, about 38 percent of the Southern Region was in drought, including 11 percent in Extreme Drought and 2 percent in Exceptional Drought. Drought in early 2023 was confined to Texas and Oklahoma, with areas of Extreme and Exceptional Drought in central and western Oklahoma, portions of the Texas panhandle and central Texas. Throughout winter 2023, the spatial pattern of drought in the Region remained steady, with winter precipitation chipping away at the edges of Exceptional and Extreme drought in Oklahoma. By the end of February, a patch of Extreme Drought emerged in deep south Texas. March saw the expansion of drought conditions on the southern boundaries of the Region, with the expanding Extreme Drought in south Texas and the southeast Louisiana coast. Water levels and flows along much of the lower Mississippi River remained well below historical means, with the exceptions being Memphis, Tennessee and Greenville, Mississippi where above average heights were observed. Again, in April the spatial extent of drought remained stable, with improvements limited to deep south and eastern Texas. In the areas experiencing drought the primary impacts are low reservoir levels, low streamflow, and poor conditions of pasture and crops. As of April 30th, 61 percent of the winter wheat in Oklahoma and 57 percent of winter wheat in Texas was rated as Poor to Very Poor condition. During May the spatial extent and intensity of drought improved in many areas across the Southern Region, particularly in the Texas Panhandle, central Texas, and western and central Oklahoma. The percentage of the Region experiencing moderate drought (D1) or worse decreased from 35 percent on May 2nd to 24 percent on May 30th. During June the spatial extent and intensity of drought saw improvements in the Texas Panhandle, western Oklahoma, and portions of central Tennessee, while conditions along the southeast Louisiana Gulf Coast, central Texas, and deep south Texas saw worsening drought conditions. Despite improvements in drought status in many areas, areas that have experienced substantial drought continued to see impacts, particularly in the agriculture sector. As of July 2nd, the percentage of land with short to very short topsoil moisture in Texas and Louisiana was 70 percent and 55 percent. Pasture and rangelands in Texas, Arkansas, and Louisiana continued to show stress with only 26 percent, 38 percent, and 39 percent being rated as good to excellent. During July the Southern Region saw improvement of drought conditions across the Texas Panhandle, much of Oklahoma, northern Arkansas, northern Mississippi, and much of Tennessee. In the southern portions of the Region degradation of drought status was common, particularly in far west Texas and central Texas where some areas saw as much as three categories of degradation. In contrast to dry conditions across Louisiana and Texas, heavy rain events throughout the month led to reports of flash flooding in Oklahoma, Arkansas, Mississippi, and Tennessee. During August the Southern Region saw degradation of drought conditions across a majority of the Region, the exceptions being northern Oklahoma, northern Arkansas, and isolated areas of Tennessee and deep south Texas. As of August 29th, northern Oklahoma, most of Arkansas, northern Mississippi, and much of Tennessee remained drought free. Extreme and exceptional drought, according to the US Drought Monitor, expanded significantly across the Region during August with much of that expansion occurring from central Texas across through coastal Mississippi. Drought conditions, exacerbated by record hot temperatures, led to short to very short topsoil conditions across much of the Southern Region, the exception being Tennessee. Dry and hot conditions led to burn bans, water restrictions, and low streamflow in areas affected by drought. In the Highland Lakes in Texas, the lowest inflows on record were recorded in August, with records dating back to 1942. During September, degradation of drought conditions were common in the eastern portion of the Southern Region, particularly Mississippi where the central part of the state saw three classes of degradation from August 29th to September 26th. Southern Oklahoma and northern Texas also experienced degradation of drought conditions. Texas experienced some improvement in isolated areas that received much needed rain during September. Low flows on the Mississippi River began to snarl barge traffic and contributed to saltwater intrusion creeping up the Mississippi that stopped just south of New Orleans, Louisiana. Rangeland and pasture conditions in the western portions of the Region continued to suffer, and there were increased reports of ranchers reducing the size of their herds due to feed and water limitations. During October the Southern Region saw improvement in drought conditions across its western portions, particularly the reduction of extreme or exceptional drought from central Texas north through southern Oklahoma. The USDA Crop Progress Report for October 29th reported that the cotton crops in Texas and Oklahoma were only reporting ten and three percent of crops to be in Good to Excellent condition, while Louisiana, Mississippi, Arkansas, and Tennessee fared much better with 48 percent, 45 percent, 74 percent, and 83 percent being rated as Good to Excellent respectively. In early October, the lower Mississippi River was essentially closed to barge traffic due to low flows, reopening on October 10th. In November the Southern Region saw continued drought and degradation of drought conditions across much of Louisiana, Mississippi, Tennessee, and southeastern Arkansas. Texas, on the other hand, saw a broad improvement of drought conditions across the state, though drought persisted in central Texas and southeast Texas. In December the Southern Region saw continued drought and degradation of drought conditions across much of Louisiana, Mississippi, Arkansas, central and western Tennessee, and portions of deep east Texas. Isolated pockets of Extreme and Severe drought are still present in central Texas and far west Texas. In the last week of 2023, 46% of the Southern Region was in drought, including 5% in Exceptional Drought and an additional 13% in Extreme Drought.
Across the Southern Region, there were 345 tornado reports, 2065 severe hail reports, and 3,646 severe wind reports, according to NOAA’s Storm Prediction Center. In total there were 298 injuries and 53 fatalities associated with severe weather during the 2023 calendar year. The year 2023 was another quiet year in terms of tropical cyclones with only one named storm (Tropical Storm Harold) making landfall, in south Texas on August 22nd, though moisture being transported into the Region from the eastern Pacific’s Hurricane Otis on October 25th-27th led to heavy rains across Texas, Oklahoma, and Arkansas. Twenty-eight tornadoes were reported across the Southern Region in January, impacting the states of Texas, Oklahoma, Louisiana, Arkansas, Mississippi, and Tennessee. On January 31st, portions of central and western Texas were impacted by an ice storm causing power outages, traffic accidents, travel delays, power outages, and related injuries. Over the next several days this storm would continue to affect northern Texas and spread into areas of Arkansas, Mississippi, and Tennessee. On February 16th, an EF2 tornado at Pindall, Arkansas injured one and an EF2 near Ripley, Mississippi injured one. On February 26th an EF2 tornado near Norman, Oklahoma injured 12, and an EF2 tornado near Cheyenne, Oklahoma resulted in one fatality. Thirty tornadoes were reported across the Southern Region in March, impacting all states within the Region. Most of the tornadoes were associated with outbreaks of severe weather on March 24th and March 31st. In total, 119 injuries and 26 fatalities were associated with tornadoes during March. Forty tornadoes were reported across the Southern Region in April, impacting all six states in the Region. Ongoing dry conditions and high winds led to wildfires occurring in Texas and Oklahoma during April, resulting in evacuations, road closures, and damage to structures though overall fire activity was near normal. Twenty tornadoes were reported across the Southern Region in May, impacting the states of Oklahoma, Texas, Louisiana, and Arkansas, resulting in three injuries. Heavy rainfall in the Texas panhandle during May led to several reports of flash flooding and flooded roadways during heavy rain events. During June 14-19, there were 52 daily maximum temperature records set and 86 daily high minimum temperature records set, an indication of the high humidity that was present during the early part of the heat wave. The heat wave peaked on June 21-23, with five all-time maximum temperature records, three all-time high minimum temperature records, and a total of 205 daily maximum and high minimum temperature records. Thirty-six tornadoes were reported across the Southern Region in June, impacting all six states in the Southern Region. On June 18th, an EF3 tornado in Louin, Mississippi resulted in 25 injuries and one fatality. On June 21st, an EF3 tornado in Matador, TX resulted in four fatalities. For Texas, this was the most tornado fatalities in one month since December 2015. One of the big stories for July in the Southern Region was the continued heat wave that impacted much of the southern portions of the Region beginning in June. The extreme heat in the Region particularly impacted Texas, where 123 stations in the state reported 3 weeks or more of 100+F days during July. July saw less severe weather than previous months in 2023, with just three tornadoes reported across the Southern Region. August saw continued record-breaking heat across much of the Southern Region, particularly in Texas, Louisiana, and Mississippi. In Texas, 285 stations reported 3 weeks or more of 100+ F days during August. Two stations in Texas had maximum temperatures at or above 100 F on all 31 days during August: Columbus and Austin. Louisiana and Mississippi saw extreme heat as well, with 33 and 9 stations respectively reporting 3 weeks or more of 100+ F days during August. The Southern Region saw its first landfalling tropical system in almost two years, Tropical Storm Harold, making landfall in south Texas on August 22nd with 50 mph winds near South Padre Island. The storm brought gusty winds and much-needed rain to the affected area. Over 35,000 people lost power in southern Texas. The London Independent School District was closed for several days due to classroom and septic system damage. September saw continued record-breaking heat across Texas, which experienced its warmest September on record and had 14 stations that experienced at least three weeks of 100 F or higher maximum temperatures during September. In drought-affected areas of the Region, dry and hot conditions throughout the summer led to damages to water infrastructure and building foundations due to shrinking of soils. A major hailstorm ravaged the northern Austin area on the night of September 24, producing hail up to 4 inches in diameter. The waiting list for vehicle rentals in the wake of the storm was thousands long. Moisture being transported into the Region from Hurricane Otis in October 25th-27th led to heavy rains across Texas, Oklahoma, and Arkansas. This led to reports of street flooding and severe weather across this swath of the Region. Despite that, October was a quiet month for severe weather for much of the Region. There were seven reported tornadoes in the Southern Region during October, affecting Texas and Oklahoma. All tornadoes were rated EF-0 and no injuries or fatalities were reported with these storms. November was also a quiet month for severe weather in the Southern Region. There were eleven tornados in November, affecting only Louisiana and Mississippi. Four of these were rated as EF0 and seven were rated as EF1. No injuries or fatalities were reported with these tornadoes. An outbreak of severe weather on December 9th impacted Mississippi and Tennessee, resulting in multiple fatal tornadoes. There were ten tornadoes in total, all on December 9th, including three in Mississippi and seven in Tennessee. The ratings of these tornadoes were: 2 EF0, 3 EF1, 4 EF2, and 1 EF3. An EF1 tornado impacted Gibson, Tennessee, injuring three. An EF2 tornado hit Cumberland Furnace, Tennessee, injuring two. Another EF2 tornado hit White Bluff, Tennessee, injuring four. The EF2 tornado that impacted Madison, Tennessee injured 22 and resulted in three fatalities. An EF3 tornado that hit Clarksville, Tennessee injured 62 and resulted in four fatalities.
The large-scale weather patterns across the West in 2023 were partially driven by a transition from three straight years of La Niña, ending in summer, to a moderate strength El Niño that developed by late Autumn. In California, the Great Basin, and Rocky Mountains, cold and wet conditions with a deep snowpack (record breaking for some) was the highlight for the first half of the year and ended a three-year drought for the region with replenished surface water supply by summer. Extreme heat and a weak monsoon during summer contributed to a warm and dry year for most of Arizona and New Mexico. Autumn and early winter (September-December) were warm and relatively dry leading to widespread snow drought conditions developing by the end of the year.
Temperatures were 1-3 degrees Fahrenheit above normal in Washington, northern Oregon, northern Idaho, most of Montana, southern Arizona, and most of New Mexico, and much of this region experienced a top ten warmest calendar year on record. Portland, Oregon saw its second warmest year on record with a mean temperature of 56.6 degrees Fahrenheit (1.5 degrees Fahrenheit above normal); Missoula, Montana also had its second warmest year on record with a mean temperature of 47.5 degrees Fahrenheit (2.3 degrees Fahrenheit above normal); Phoenix, Arizona had an annual mean temperature of 77 degrees Fahrenheit (1.4 degrees Fahrenheit above normal) making it the fourth warmest year on record. Most of California, the Great Basin, and northern Arizona had one the coldest years in the past decade with temperatures generally 1-2 degrees Fahrenheit below normal.
The big precipitation story this year was drought busting totals for much of California, the Great Basin, and parts of the Upper Colorado River Basin with some places seeing over 200 percent of normal annual precipitation. In California, Los Angeles had its sixth wettest year in the past 124 years with 29.44 inches of precipitation (207 percent of normal) and Bishop, on the east side of the Sierra Nevada, had its second wettest year with 14.55 inches of precipitation (301 percent of normal). In the Great Basin, Yerington, Nevada had its wettest year on record with 10.67 inches of precipitation (233 percent of normal). Drier than normal conditions prevailed across most of the Pacific Northwest, Arizona, and New Mexico. Thompson Falls, Montana logged 14.5 inches of precipitation (66 percent of normal) for the driest year on record; Eugene, Oregon had its sixth driest year on record with 28.99 inches of precipitation (71 percent of normal); Phoenix, Arizona saw its 11th driest year on record with 4.21 inches of precipitation (58 percent of normal).
April 1 snowpack was at record high levels based on the SNOTEL network throughout the Sierra Nevada, Great Basin, Arizona, and West Slope of Colorado. Snow water equivalent (SWE) was 200-300 percent of normal. Some snow course in the Sierra Nevada broke April 1 SWE records going back 90-100 years; Mammoth Pass, in the central Sierra Nevada, California, had 104.5 inches of SWE marking it the highest April 1 value in 93 years of records. The wet and snowy winter helped to eliminate drought across much of the West; in early January, 62 percent of the West was in drought with extreme drought (D3) or worse in six states while only 24 percent of the West was in drought at the end of 2023 with D3 and exceptional drought (D4) confined to Arizona and New Mexico. A weak monsoon and hot summer helped drive drought expansion in Arizona and New Mexico and, the Pacific Northwest was another region with drought expansion in 2023.
Temperatures in Alaska were warmer than normal in the Panhandle, North Slope, and most of the Interior, colder than normal in West, and near normal in South Central. Sitka had its second warmest year on record with a mean temperature of 47.8 degrees Fahrenheit (2 degrees Fahrenheit above normal), Utqiagvik its fourth warmest year with a mean temperature of 17.8 degrees Fahrenheit (3 degrees Fahrenheit above normal), and Juneau its fifth warmest year with a mean temperature of 44.1 degrees Fahrenheit (2 degrees Fahrenheit above normal). Most of the state had a wetter than normal year except for the Aleutian Islands and much of the Kenai Peninsula. Kotzebue saw its wettest year on record with 17.35 inches of precipitation (153 percent of normal), Little Port Walter its second wettest year with 286.06 inches of precipitation (116 percent of normal), and Anchorage its third wettest year on record with 24.22 inches of precipitation (148 percent of normal). Kenai had its second driest year on record with 9.51 inches of precipitation (52 percent of normal).
Precipitation across Hawaii was mixed with some regions above normal and others below. It was a generally dry year when considering the entire state with drought conditions developing in early summer and peaking in mid-November when 93 percent of the state was in drought with 12 percent in extreme drought. Dry conditions played a factor in the devastating Lahaina fires, on the Island of Maui, that occurred in early August. Kahului, on the Island of Maui, received 11.04 inches of precipitation (68 percent of normal) in 2023. Kauai was one of the Islands with above normal annual precipitation; Lihue recorded 42.88 inches of precipitation (118 percent of normal). Temperatures were generally near-to-slightly above normal across the state in 2023.
Early January storms bring major coastal impacts to central California: A series of strong winter storms with heavy rainfall, high winds, and large ocean waves that coincided with high tides caused major flooding and damage to areas of California’s central coast. Capitola, just to the east of Santa Cruz, was hit particularly hard with many oceanfront properties and businesses severely damaged including the 166-year-old Capitola Wharf. Initial estimates of damage in Santa Cruz County came in at $36 million. February 21-24 Cold Surge: An extremely cold airmass that formed over the Canadian Arctic surged southward in late February bringing four days of extreme cold to the interior western U.S. Billings, Montana, reached -18 degrees Fahrenheit and Yellowstone National Park in Wyoming bottomed out at -20 degrees Fahrenheit. Cold temperatures and strong mountain top winds caused wind chills to drop as low as -35 degrees Fahrenheit in many regions. Extreme snowfall in southern California mountains leaves residents and visitors stranded: A series of cold storms impacted southern California at the end of February into the beginning of March dropping a total of over 100 inches of snow in parts of the San Bernadino mountains. While winter snow is common in this region the magnitude of this event was extreme and left many stranded in homes for weeks. At least 12 people were reported dead following this event, mostly elderly and people with chronic illness. Snowmelt Runoff Lowers Salinity in the Great Salt Lake: The historic snowpack built throughout Utah, but especially the Wasatch, began to melt in earnest during April. Snowmelt runoff flowing into the Great Salt Lake caused the lake to rise multiple feet with further rises expected. This is excellent news from lake chemistry and ecological perspectives as freshwater input to the south arm is now spilling into the hypersaline northern half. The freshwater is lowering lake salinity and helping stave off ecological collapse triggered by reduction of the lake's keystone species, the brine shrimp. Flooding from snowmelt runoff brought issues to California and Nevada as well, especially in the Tulare Lake Basin of California's San Joaquin Valley. Early season wildfire outbreak in Canada brings degraded air quality to parts of the West: Drought and early season heat waves have increased fire danger across Alberta, Canada, and dozens of wildfires broke out in early May and have burned more than two million acres. Dense wildfire smoke has been drifting in and out of the West and primarily impacting Montana, Wyoming, and Colorado. On May 22, Denver, Colorado, ranked in the top 20 cities across the world with worst air quality. Tulare Lake receding after months of California government actions: Tulare Lake, in the San Joaquin Valley, began refilling this spring after one of the snowiest winters on record in the southern Sierra Nevada. This led to flooded croplands, roadways, homes, and other infrastructure. Through diversions and pumping mandated by the state to reduce flood impacts and make use of excess water at least 66,692 acre-feet of water have been diverted from the lake leading to lower late summer lake extent projections than originally thought at the beginning of May. Extreme heat in Arizona: July shattered many heat records in Phoenix, Arizona with 17 days having a maximum temperature above 115 degrees Fahrenheit being one notable record (previous record was six days in 2020). Overnight temperatures were also extremely warm leading to major human health impacts. Data from the Arizona Department of Health Services shows 712 visits to Arizona emergency rooms during the week of July 16 for heat-related illness with 140 heat-related deaths (many still under investigation) in Maricopa County alone. Widespread impacts from Hurricane Hilary remnants across Southern California: Tropical and post-tropical storm conditions impacted southern California on August 20-21 as remnants of Hurricane Hilary, which peaked as a Category 4 storm, moved onshore. Parts of the Transverse Range recorded more than ten inches of rain and Death Valley set its all-time single day precipitation record at 2.20 inches. Heavy rain and high winds led to flash flooding, debris flows, damaged roadways, and downed trees. At the peak of the impacts more that 50,000 people across the region were without power. Unprecedented rainfall leaves thousands stranded at Burning Man: A few months' worth of rain falls in one day, leaving thousands of people stranded at Burning Man in Nevada's Black Rock Desert in September. The half an inch of rain turned the playa into a mud field, which left vehicle transportation out of the desert impossible. Thousands had to shelter in place for a few days until conditions improved, leading to a mass exodus where people spent up to half a day stuck in traffic to get out of the Black Rock Desert. Drought triggers stage 2 water shortage in Maui, Hawaii in October: Upcountry, part of Maui County, has recently moved to a stage 2 water shortage due to worsening drought conditions. Daily water demand is exceeding supply by 20 percent and restrictions have been put in place to reduce use. The restrictions include irrigation, watering lawns, washing vehicles, and other nonessential activities. Shortage restrictions will remain in place until conditions change. Anchorage records snowiest November since records began in 1953: 39.3 inches of snowfall fell this month in Anchorage, AK. This broke the previous record of 38.8 inches set in 1994. Most of the snowfall fell in consecutive storms and compacted on main roadways due to its heavy and wet nature. High winds and temperatures a few days later led to icy conditions that caused traffic incidents and delayed travel times. The heavy snow also led to several power outages in the Anchorage area. Early December atmospheric rivers bring flooding and high snow levels to the Pacific Northwest: Strong storms the first week of December dumped 10-20 inches of precipitation in the higher elevations of Washington and Oregon causing major flooding, landslides, and at least two deaths have been reported. Warm temperatures during the latter part of the storm cycle brought snow levels over 7,000 feet and a major rain-on-snow snow melt event in the Cascades..